
TL;DR:
- Photo booth data insights help event planners measure guest engagement, behavior, and generate business intelligence beyond simple counts.
- Separating operational telemetry, client ROI metrics, and internal KPIs ensures accurate analysis and trustworthy reporting for long-term success.
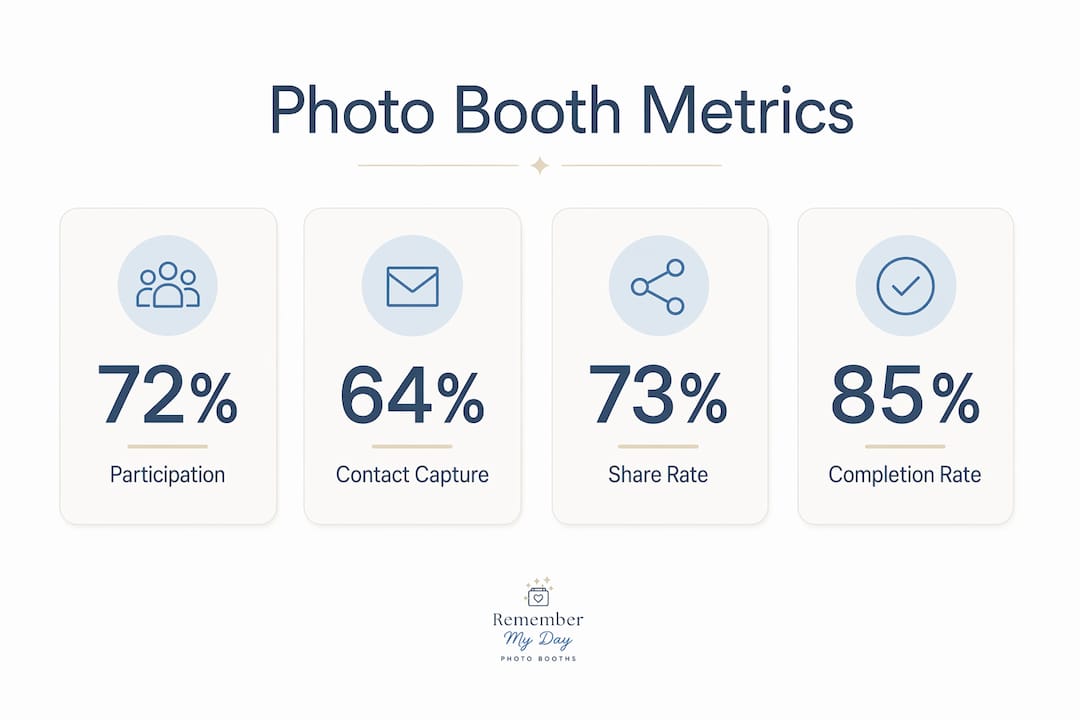
Photo booth data insights are measurable analytics derived from guest interactions that allow event planners and marketers to quantify engagement, understand behavior, and make smarter decisions about future events. The role of photo booth data insights goes far beyond counting how many photos were taken. Modern photo booth software platforms like Darkroom, Snappic, and Curator capture everything from social sharing behavior to contact opt-in rates, turning a fun activation into a genuine business intelligence tool. When you know that 64% of participants hand over their contact information at a photo booth, you start to see the booth as a lead generation asset, not just a party prop.
What key data do photo booths collect and how do they measure event engagement?
Photo booths collect far more than a headcount. The primary data categories fall into three groups: capture data, sharing behavior, and contact capture. Each one tells a different story about how guests experienced your event.

Capture data tracks the total number of photos, GIFs, or videos taken, plus the session completion rate. The session completion rate is the most predictive operational metric available, because it flags guests who abandon the email entry step or experience a technical hiccup that would otherwise go unnoticed. If your completion rate drops below 85%, something is wrong with the user flow or the hardware.
Sharing behavior reveals how guests spread your brand beyond the venue. Approximately 73% of participants share photos when prompted, with Instagram Stories accounting for 52% of all shares. That means more than half of your social reach is happening in a format that disappears in 24 hours, which has real implications for how you measure and report post-event exposure.
Contact capture is where photo booths genuinely outperform traditional lead generation methods. Photo booth opt-ins produce an invalid email rate of only 8.2%, compared to 15 to 18% for business card entries. Guests are motivated to enter a real email address because they want their photo delivered.
Here is a quick reference for the core engagement metrics you should track at every event:
| Metric | What it measures | Benchmark |
|---|---|---|
| Participation rate | % of attendees who used the booth | Varies by event size |
| Session completion rate | % of sessions fully completed | Target above 85% |
| Share rate | % of users who shared their photo | ~73% when prompted |
| Contact capture rate | % who opted in with contact info | ~64% average |
| Social impressions | Estimated reach from shares | ~847 per activation |
Pro Tip: Track session completion rate in real time during your event. A sudden drop mid-event almost always signals a technical issue, a confusing interface, or a staffing gap at the booth.
The combined picture from these metrics gives you a participation rate, a share rate, and a completion rate that together define how successfully your booth engaged guests. Photo booth activations generate an average of 847 social media impressions and an estimated marketing value of $1,200 to $3,400 per event. That range is wide, and understanding why requires knowing how to interpret the data correctly.
How to interpret photo booth analytics accurately
Accurate interpretation starts with separating three distinct data layers. Operators must distinguish between real-time operational telemetry, per-event client ROI metrics, and internal business intelligence. Mixing these layers is the most common mistake we see in post-event reporting, and it leads to either inflated claims or missed opportunities.
Here is how each layer functions in practice:
-
Real-time operational telemetry is for the operator on the day of the event. It covers printer queue status, session errors, network connectivity, and live usage rates. Clients do not need this data. It exists to keep the activation running smoothly.
-
Client ROI metrics are what you present in your post-event report. This includes total captures, share rate, contact capture count, and estimated social impressions. These numbers answer the client’s core question: was this worth the investment?
-
Internal business intelligence covers long-term KPIs like utilization rates across your booth inventory, revenue per event, and repeat booking rates. This layer informs your pricing, staffing, and growth decisions.
“Data-driven activations are central for justifying event marketing spend by quantifying earned media and lead generation beyond vague impressions.” — Camfetti Photo Booth Analytics
The biggest credibility trap in client reporting is inflated social impression counts. Many operators multiply the number of shares by an average follower count without applying any discount for reach versus impressions, organic suppression, or private accounts. The result is a number that sounds impressive but means very little. Sponsors and marketing directors at larger companies will catch this immediately, and it damages trust.
Pro Tip: When reporting social impressions to clients or sponsors, apply a conservative reach discount of 20 to 30% to your raw calculation and note your methodology. Credible numbers build longer client relationships than inflated ones.
Real-time dashboards are genuinely useful for operators managing multiple booths at a large venue. For clients reviewing post-event performance, a clean summary report with three to five headline metrics is far more persuasive than a live data feed they do not know how to read.
What strategic advantages do photo booth data insights offer marketers and event planners?
The importance of photo booth analytics becomes clearest when you apply the data to decisions that improve your next event. Photo booth data helps event planners optimize booth placement, understand peak usage times, and refine guest experiences in ways that directly improve engagement and ROI.
Here are the four strategic advantages that matter most:
-
Booth placement optimization. Usage data from past events shows exactly when and where guest traffic peaks. If your booth sees 60% of its total sessions in the first 90 minutes, you know to place it near the entrance and staff it heavily at the start of the event rather than the end.
-
Guest experience refinement. Analyzing which features guests use most, whether that is GIF mode, a branded overlay, or a specific prop set, tells you what to lead with at future events. Features with low usage rates are candidates for replacement or redesign.
-
Lead generation quality. Contact capture data feeds directly into your CRM. Because photo booth opt-ins produce far fewer invalid emails than traditional methods, the resulting list is cleaner and more actionable for follow-up campaigns.
-
Sponsor ROI justification. Quantifying brand exposure through share counts, impression estimates, and branded photo downloads gives sponsors a concrete return figure. This is the difference between a sponsor renewing their contract and walking away after one event.
| Approach | Without data insights | With data insights |
|---|---|---|
| Booth placement | Based on venue aesthetics | Based on peak traffic analysis |
| Sponsor reporting | Vague impression estimates | Quantified shares, downloads, reach |
| Lead follow-up | Generic email blast | Segmented list from opt-in data |
| Future event planning | Repeat last year’s setup | Adjust based on engagement trends |
Photo booths increasingly serve as strategic marketing assets that integrate entertainment with business intelligence and audience segmentation. That shift in how planners think about photo booths is what separates good events from genuinely memorable ones. You can read more about boosting engagement at events to see how this plays out in practice.
How can event planners leverage photo booth data insights to maximize ROI?
Turning photo booth engagement data into a repeatable advantage requires a structured workflow. Here is a practical process for getting the most from your analytics after every event:
-
Export and centralize your data immediately after the event. Most booth software platforms allow CSV exports of session data, share logs, and contact lists. Pull these within 24 hours while context is fresh. No single booth software provides all analytics layers natively, so plan to integrate exports with your CRM or a spreadsheet tool like Google Sheets or Airtable.
-
Conduct cohort analysis across multiple events. Group events by type, such as corporate, wedding, or festival, and compare participation rates, share rates, and contact capture rates across each cohort. Patterns emerge quickly. Corporate events in San Antonio, for example, may show higher contact capture rates but lower share rates than social celebrations.
-
Customize packages based on what the data reveals. If GIF mode consistently drives higher share rates than static photos, make it a standard feature rather than an add-on. If a specific branded overlay generates more downloads, use it as a template for future activations.
-
Review utilization rates to scale resources wisely. Operators who track weekend-slot utilization manage capital expenses far better than those who scale based on revenue alone. Running one booth at 80% utilization is more profitable than running three booths at 30% each. This principle applies directly to how planners should think about booth quantity at multi-zone events.
-
Integrate photo booth data with CRM and social listening tools. Combining photo booth data with CRM and social listening platforms strengthens lead generation, improves sponsor reporting, and supports long-term event strategy development. Tools like HubSpot, Salesforce, and Sprout Social all accept CSV imports from booth software exports.
Pro Tip: Build a simple post-event scorecard with five metrics: participation rate, session completion rate, share rate, contact capture rate, and estimated impressions. Review it within 48 hours of every event and compare it to your last three activations. Trends become visible faster than you expect.
Analyzing photo booth trends across a full calendar year gives you the clearest picture of what your guests actually enjoy versus what you assume they enjoy. That gap is almost always surprising. For a deeper look at how San Antonio planners are applying these methods, the event photo booth analytics guide is a strong starting point.
Key takeaways
Photo booth data insights deliver their greatest value when separated into three distinct layers: operational telemetry, client ROI metrics, and internal business intelligence.
| Point | Details |
|---|---|
| Data layers matter | Separate operational, client ROI, and internal KPIs to avoid misleading reports. |
| Contact capture quality | Photo booth opt-ins yield only ~8.2% invalid emails, far outperforming business cards. |
| Social sharing benchmark | 73% of guests share when prompted, with Instagram Stories leading at 52% of shares. |
| Avoid inflated impressions | Apply a reach discount to social impression estimates to maintain credibility with sponsors. |
| Integrate and analyze | Combine booth data exports with CRM tools like HubSpot or Airtable for longitudinal insights. |
Our take on making photo booth data actually work for you
After working with hundreds of events across San Antonio and beyond, we have seen one pattern repeat itself more than any other: planners collect the data and never look at it again. The post-event report gets sent to the client, filed away, and forgotten. That is where the real opportunity gets left on the table.
The most effective event planners we work with treat every activation as a data point in a longer story. They compare this wedding to the last three weddings. They notice that their 360° booth consistently drives higher share rates than their traditional booth at corporate events, and they use that to guide their recommendations. They are not just running events. They are building a knowledge base.
We also think the industry has a credibility problem with social impression reporting. Inflated numbers feel good in the moment but erode trust over time. We would rather show a client a conservative, well-explained estimate than a headline number that falls apart under scrutiny. Honest reporting is what turns a one-time booking into a long-term partnership.
The personalized photo booth experiences that generate the best data are the ones where guests are genuinely engaged, not just going through the motions. Design the experience first, measure it second, and let the data tell you how to make it better next time. That cycle is what separates good events from truly unforgettable ones.
— RMD
See how Rmdphotobooths brings data-driven experiences to life
At Rmdphotobooths, we design every activation with both guest experience and measurable outcomes in mind. Our photo booth solutions, from 360° booths to AI-powered portrait experiences, are built to generate the kind of engagement data that actually means something to event planners and their clients.

Whether you are planning a corporate event in San Antonio or a large-scale celebration, our team helps you choose the right booth format to maximize participation, sharing, and contact capture. Explore our full range of photo booth experiences to see which activation fits your event goals, or head straight to our booking page to lock in your date. We would love to help you create those “wow” moments your guests will treasure forever.
FAQ
What is the role of photo booth data insights at events?
Photo booth data insights measure guest participation, social sharing behavior, and contact capture rates to help planners quantify engagement and justify event marketing spend. They serve as the evidence layer that turns a fun activation into a measurable business asset.
What is a good contact capture rate for a photo booth?
A strong benchmark is 64% of participants opting in with their contact information, based on industry data from photo booth software activations. Photo booth opt-ins also produce far fewer invalid emails than traditional methods, at around 8.2% versus 15 to 18% for business cards.
How do you avoid inflated social impression numbers in reports?
Apply a conservative reach discount of 20 to 30% to any impression estimate calculated from share counts multiplied by follower averages. Documenting your methodology in the client report builds credibility and prevents unrealistic expectations.
Which platforms do guests use most to share photo booth images?
Instagram Stories is the leading sharing platform, accounting for 52% of all photo booth shares when guests are prompted to share. This matters for reporting because Stories disappear after 24 hours, which affects how you measure and document post-event reach.
How should event planners integrate photo booth data with other tools?
Export session data, share logs, and contact lists from your booth software within 24 hours of the event, then import them into a CRM like HubSpot or Salesforce. Combining this data with social listening tools like Sprout Social gives you a fuller picture of your event’s marketing impact.